

Catchment-to-Coast Data Analysis & Strategy
We deliver expert analysis and clear, actionable reports for clients in government, engineering, carbon development, and research.
Our Services:
-

Catchment-to-Coast Strategic Analysis:
We conduct comprehensive desktop studies (such as catchment assessments and dieback investigations) to identify the proper drivers of environmental change and offer clear management recommendations.
-

Aquatic Habitat Mapping:
We utilise advanced Machine Learning (ML) and Google Earth Engine (GEE) to produce high-accuracy, scalable maps of key assets, including seagrass, mangroves, and coral reefs, for Blue Carbon and conservation projects.
-
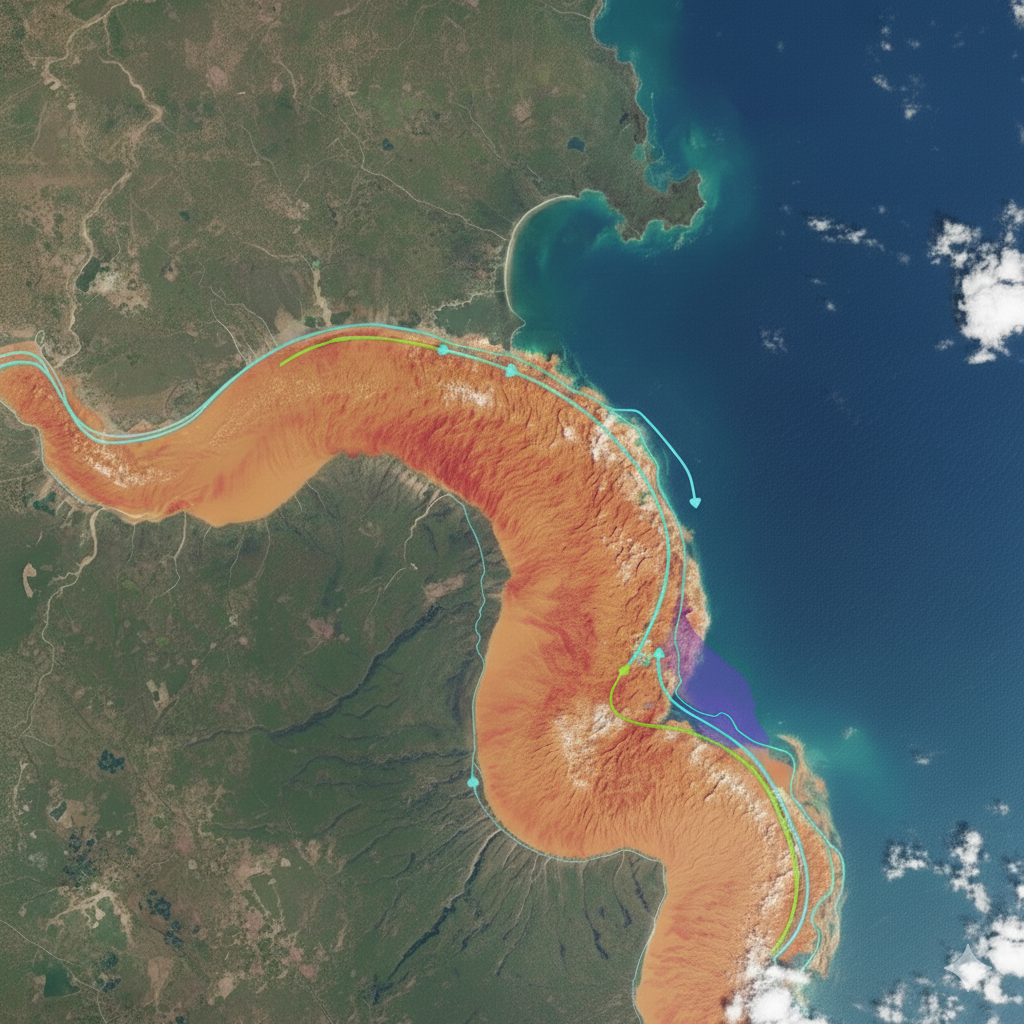
Coastal & Riverine Process Monitoring:
We utilise multi-sensor data (including cloud-penetrating Radar) to monitor dynamic events. Our services include flood plume analysis, long-term erosion and accretion monitoring, and water quality trend analysis.
-

Data Automation:
We develop customised GEE & Python tools for consultancies, councils, and NRMs, transforming your manual, multi-day analyses into a single automated workflow.